Linux load average explained: what the three numbers mean, and how to find the culprit with top
What load average actually measures, why you compare it with the CPU count, how to read the 1, 5 and 15-minute trend, why high load with idle CPUs points at disks, and how to find the process behind it with top.
The OpsPath team
7 min readlinuxtroubleshootingperformancecommand-line
"The server is slow." You SSH in, run uptime, and get three numbers:
$ uptime
 22:37:36 up 28 days,  1:20,  0 user,  load average: 3.70, 1.78, 1.29
Is 3.70 bad? It depends entirely on one thing most people forget to check. This post explains what those numbers measure, how to read them in a few seconds, and how to find the process behind them with top.
Every output here is real, captured on a 16-CPU Linux machine.
What load average measures
Load is the number of processes that want to run: the ones running on a CPU right now, plus the ones queued and waiting for one. On Linux it also counts processes stuck in uninterruptible sleep (state D), usually waiting on a disk or a network filesystem. More on that below, because it's the part that catches people out.
The kernel samples that count every few seconds and keeps three moving averages, over roughly 1, 5 and 15 minutes. That's all the three numbers are. You can read them straight from the kernel:
$ cat /proc/loadavg
1.28 1.49 1.24 6/2667 33
The fourth field is processes running right now over the total, and the last is the most recent process ID.
Rule 1: compare it with the CPU count
A load of 4 means "about four processes wanted a CPU". Whether that's a problem depends on how many CPUs there are:
$ nproc
16
- 4 on 16 CPUs: a quarter busy. Quiet.
- 4 on 4 CPUs: every CPU busy, nothing waiting. Fully used, but no queue yet.
- 8 on 4 CPUs: twice as much work as the machine can run. Things are waiting, and users feel it.
So the useful number is load ÷ CPUs. Around 1 is full. Well above 1 means a queue. The load average on its own, without nproc, tells you almost nothing.
Rule 2: read the three numbers as a trend
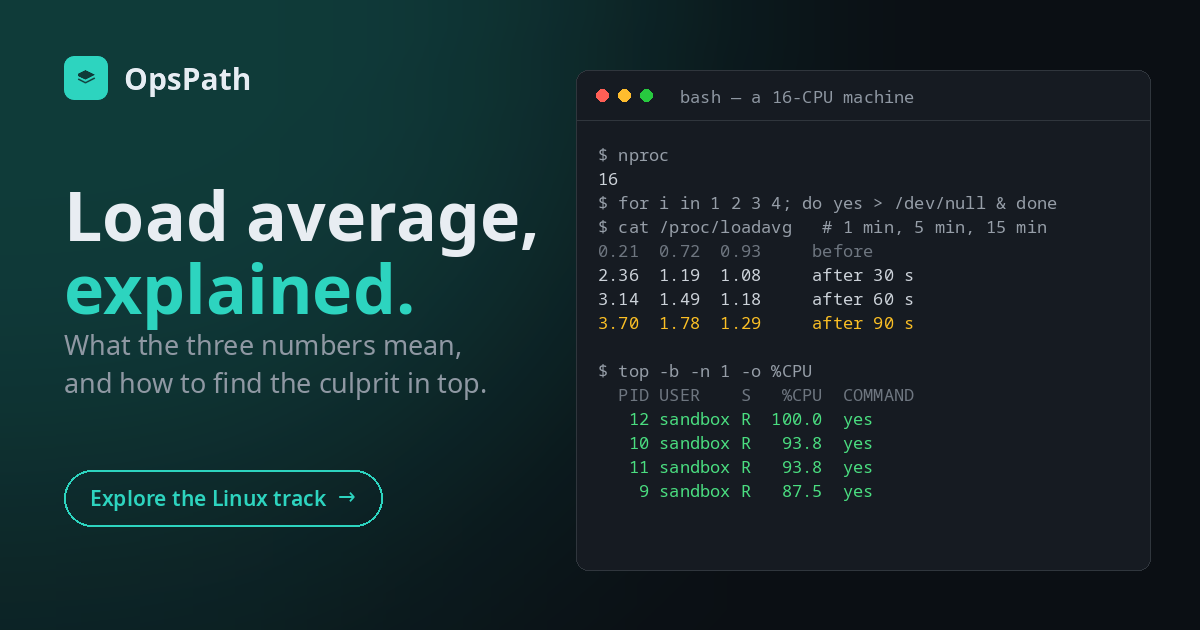
Here's what happens when four busy processes start on this 16-CPU machine (yes > /dev/null keeps one CPU fully busy):
$ for i in 1 2 3 4; do yes > /dev/null & done
$ cat /proc/loadavg        # sampled every 30 seconds
0.21 0.72 0.93     before
2.36 1.19 1.08     after 30 s
3.14 1.49 1.18     after 60 s
3.70 1.78 1.29     after 90 s
The real load jumped to 4 instantly, but the 1-minute average climbs towards it over a minute or two, the 5-minute one slower still, and the 15-minute one barely moves. That lag is what makes the trio useful:
| Pattern | Example | What it means |
|---|---|---|
| 1 > 5 > 15 | 3.70, 1.78, 1.29 | it's getting worse, right now |
| 1 < 5 < 15 | 0.40, 2.10, 3.50 | it was bad and is recovering |
| all similar | 3.9, 4.0, 4.1 | steady: this is normal for this machine, or a long-running problem |
So 3.70, 1.78, 1.29 on 16 CPUs says: not overloaded, but something started in the last minute or two. Worth a look.
Rule 3: high load with idle CPUs means disks, not CPU
Because Linux counts processes in D state, load can be high while the CPUs are doing almost nothing. The classic causes are a slow or failing disk, an overloaded storage volume, or a hung NFS mount: dozens of processes all waiting on I/O, each adding 1 to the load.
The tell is in top's CPU line, in the wa (I/O wait) figure, and in the process states:
top                              # high wa, low us = waiting on I/O
vmstat 1                         # column r = runnable, b = blocked on I/O
ps -eo state,pid,cmd | grep '^D' # the processes stuck waiting
If the CPUs are idle and the load is high, adding CPUs won't help. Find what they're waiting for.
Finding the culprit with top
top shows the same load average on its first line, then a summary, then the processes, sorted by CPU. Here it is during the test above, in batch mode (-b -n 1 prints one screen and exits, which is also how you'd use it in a script):
$ top -b -n 1 -o %CPU
top - 22:37:36 up 28 days,  1:20,  0 user,  load average: 3.70, 1.78, 1.29
Tasks:   7 total,   5 running,   2 sleeping,   0 stopped,   0 zombie
...
    PID USER      PR  NI    VIRT    RES    SHR S  %CPU  %MEM     TIME+ COMMAND
     12 sandbox   20   0    2500   1304   1200 R 100.0   0.0   1:30.15 yes
     10 sandbox   20   0    2500   1256   1152 R  93.8   0.0   1:30.14 yes
     11 sandbox   20   0    2500   1272   1168 R  93.8   0.0   1:30.14 yes
      9 sandbox   20   0    2500   1304   1200 R  87.5   0.0   1:30.14 yes
What to read:
Tasks: 5 running is our fouryesprocesses plustopitself. Watch thezombiecount too.%CPUis measured per CPU: 100% is one full core, so a multi-threaded process can show 400%.Sis the state:Rrunning,Ssleeping,Dwaiting on I/O (the ones from Rule 3),Zzombie.RESis the memory actually in RAM. Sort by memory with-o %MEMwhen memory is the problem.TIME+is CPU time used so far: 1:30 here, because eachyeshas been running flat out for 90 seconds.
Interactively (just top), the keys you'll use most are P to sort by CPU, M by memory, 1 to show each CPU separately, k to kill a process and r to renice one.
One trap with batch mode: the first screen's %Cpu(s) line is measured over almost no time, so it can be wildly off. With the same four yes processes running, ask for two screens a second apart and compare:
$ top -b -n 2 -d 1 | grep '^%Cpu'
%Cpu(s):  0.0 us, 50.0 sy,  0.0 ni, 50.0 id,  0.0 wa,  0.0 hi,  0.0 si,  0.0 st
%Cpu(s): 14.2 us, 13.7 sy,  0.0 ni, 72.0 id,  0.1 wa,  0.0 hi,  0.1 si,  0.0 st
The first line claims the machine is half idle and doing nothing but kernel work. The second is right: about 28% busy, which is four of sixteen CPUs plus everything else on the machine. Read the second screen.
Inside a container, load average describes the host
/proc/loadavg isn't namespaced, so inside a container uptime and top report the whole host's load, not your container's. A container that's capped at one CPU can be badly starved while the host's load looks calm.
We saw exactly that while writing this post. The same four yes processes in a container limited to one CPU barely moved the host's load average (it read 1.28). That's because a capped container's processes are throttled: once it has used its CPU share for the current period, its processes are taken off the run queue until the next one, so they mostly aren't counted. The container's own cgroup tells the real story:
$ cat /sys/fs/cgroup/cpu.max
100000 100000                      # 1 CPU: 100 ms of CPU every 100 ms
$ grep -E 'nr_periods|throttled' /sys/fs/cgroup/cpu.stat    # after 10 s of the test
nr_periods 103
nr_throttled 101
throttled_usec 30229710
Throttled in 101 of 103 scheduling periods, and 30 seconds of throttled time (summed across CPUs) in 10 seconds. In a container or a Kubernetes pod, check cpu.stat (and the pod's CPU limit), not just the load average.
Dealing with the process
Once you've found it:
- Stop it politely:
kill <PID>sends SIGTERM, which lets it clean up and exit. Usekill -9only if it's still there a few seconds later. - Or make it wait its turn:
renice -n 10 -p <PID>lowers its priority, so everything else gets the CPU first. That's the better choice for a backup or a report you still want to finish. - Then ask why: a stuck loop, a runaway retry, a cron job overlapping with itself? The
TIME+column and the command line (ps -fp <PID>) are good places to start.
Practise on a misbehaving machine
The Processes & top lesson on OpsPath starts a small, misbehaving app in your browser's sandbox: two idle web workers, a report job stuck in a busy loop, and a cache holding 120 MB. You find each one with top and ps, stop the runaway with a signal, and lower its priority with renice instead, with every step checked. Disk & System Health covers the rest of the first five minutes: full disks, memory, and why free misleads inside a container.
Both are part of the Linux & the Command Line track, which starts free with Navigate the Filesystem. Running the lessons needs a free account, and the two lessons above are part of Pro.